How Graphsignal uses dstack for inference benchmarking
In a recent engineering blog post, Graphsignal shared autodebug, an autonomous loop that deploys an inference service, benchmarks it, updates the deployment config, and redeploys it again. This case study looks at the team workflow behind that setup, and how dstack gives Graphsignal a common layer for GPU development, inference deployment, and benchmarking.
Graphsignal builds inference observability and AI debugging tooling for teams running production inference across models, engines, and GPUs. That puts the team close to the systems they measure and tune: inference servers, GPU infrastructure, deployment workflows, and benchmark loops.
To benchmark and optimize inference efficiently, the Graphsignal team combines:
- on-prem GPU systems, including NVIDIA DGX Spark devices managed through
dstack - cloud GPU capacity, including Verda as a supported
dstackbackend dstackas the common orchestration layer for GPU development and inference deployment
For Graphsignal, the same operational model applies across on-prem systems and GPU clouds. The team can develop on GPU-backed environments, deploy inference services, and rerun benchmarks without switching orchestration models between environments.
Many teams running inference need a workflow that:
- works across different GPU environments
- supports both development and production
- does not require building and maintaining custom orchestration for every provider
dstack gives the Graphsignal team a declarative way to provision GPU resources, deploy inference services, and iterate on deployment configs across environments without introducing a separate control plane for each provider.
dstackgives us a unified layer for GPU development and inference across on-prem systems and GPU clouds. It is fine-grained enough for serious inference engineering, but simple enough that we do not have to build and maintain custom orchestration around every GPU environment we use.— Dmitry Melikyan, Founder at Graphsignal
The Graphsignal team primarily uses these dstack components:
- Dev environments — for GPU-backed development and experimentation
- Services — for deploying inference endpoints and running benchmarkable workloads
- Fleets — for spanning on-prem systems and cloud backends through one interface
- the
dstackCLI — withdstack applyused directly in the deployment and benchmarking loop
In practice, this gives the Graphsignal team a way to:
- move from GPU development to production inference without changing orchestration layers
- turn a serving change into a fresh, versioned deployment
- run benchmarks on real hardware across on-prem and cloud environments
- keep the same workflow for development, deployment, and repeated optimization
The examples below are representative dstack configurations that illustrate the workflow described above. They are included to show how the same control plane can span on-prem hosts and cloud backends, not as Graphsignal production configs.
For on-prem systems such as DGX Spark devices, dstack can manage multiple hosts through a single SSH fleet definition.
type: fleet
name: graphsignal-onprem

ssh_config:
  user: ubuntu
  identity_file: ~/.ssh/id_rsa
  hosts:
    - dgx-spark-1
    - dgx-spark-2
    - dgx-spark-3
For cloud GPU, dstack supports Verda as a native backend.
projects:
  - name: main
    backends:
      - type: verda
        creds:
          type: api_key
          client_id: YOUR_CLIENT_ID
          client_secret: YOUR_CLIENT_SECRET
For Graphsignal, dstack acts as a unified orchestration layer for GPU development and inference across on-prem systems and GPU clouds. It gives both developers and agents a fine-grained interface for editing configs, deploying services, and iterating on infrastructure without switching tools or rebuilding workflow around each environment.
For agentic workflows, dstack skills extend that same interface to tools such as Claude Code, Codex, and Cursor.
$ npx skills add dstackai/dstack
Once installed, they let an agent work directly with dstack configs and CLI commands: create or edit a *.dstack.yml, apply the configuration, check run status, and manage fleets, etc.
Claude Code can use Graphsignal telemetry to decide what to change next, then use dstack to generate the updated service config and invoke the CLI on the team’s behalf.
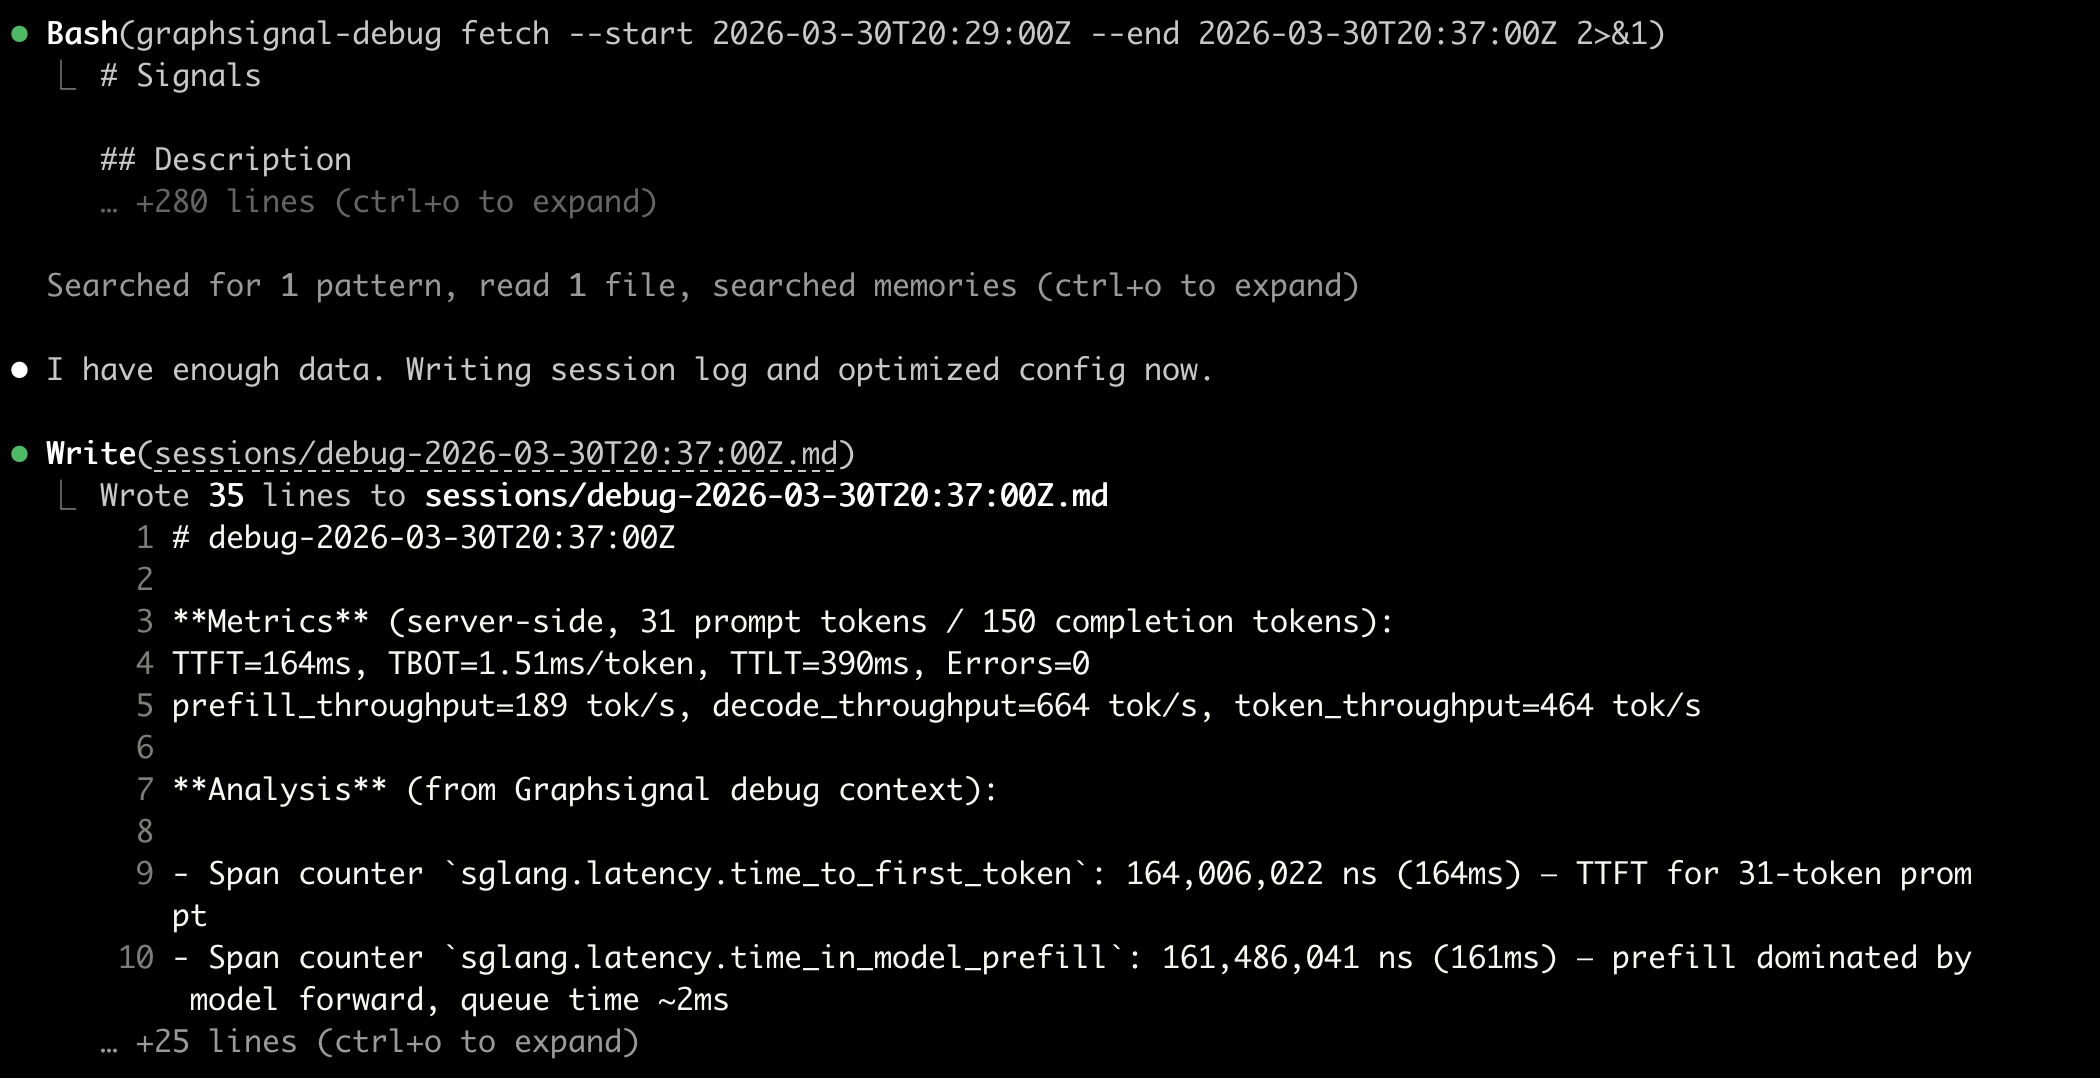
The point is not a single benchmark run, but a repeatable workflow in which deployment, measurement, and optimization stay inside the same system.
Agentic engineering is changing not only how code gets written, but how compute gets orchestrated and how inference gets optimized. Once the deployment layer is programmable, agents can participate directly in benchmarking, redeployment, and performance tuning.
— Dmitry Melikyan, Founder at Graphsignal
Instead of treating performance testing as a separate script, the team can run it as a loop: benchmark a live endpoint, inspect logs and telemetry for the same time window, identify bottlenecks, update the dstack service config, redeploy, and run the next iteration.
Huge thanks to Dmitry Melikyan and Bogdan Sulima at Graphsignal for feedback and collaboration. For more details, see Graphsignal’s engineering post on autodebug.
What's next?
- Follow the
InstallationandQuickstartguides - Explore
dev environments,tasks,services, andfleets - Use Graphsignal’s
dstackintegration guide to add profiling, tracing, and monitoring to adstackinference service